Using Visual Studio Code (VSCode)
VSCode is one of several integrated development environments that can be used to develop projects using Babylon.js. It has the advantage of Git integration built-in and a plugin to display .babylon files.
You can install VSCode from their site: https://code.visualstudio.com/
Useful plugins
Once installed, a few plugins will help you have the best experience. You can search for them in the extension tab (Ctrl+Shift+d):
- Debugger for Chrome as well as the chrome browser
- Shader languages support for VSCode for syntax highlighting and autocompletion in glsl shader
- Babylon.js file viewer can be used to display the content of a .babylon file directly in VSCode. It can be useful if you want to quickly check if your artist did a good job with an object and their names :)
Keybindings setup
Finally, I would recommend adding a few shortcuts to your environment. Follow the guide:
- To configure keyboard shortcuts the way you want, go to the menu under File > Preferences > Keyboard Shortcuts. (Code > Preferences > Keyboard Shortcuts on Mac)
- Click
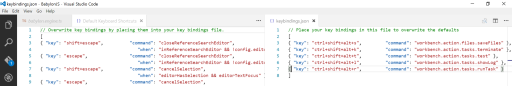
Open Keyboard Shortcuts (JSON)on the right side and add:
// Place your key bindings in this file to overwrite the defaults[ { "key": "ctrl+shift+alt+s", "command": "workbench.action.files.saveFiles" }, { "key": "ctrl+shift+alt+k", "command": "workbench.action.tasks.terminate" }, { "key": "ctrl+shift+alt+t", "command": "workbench.action.tasks.test" }, { "key": "ctrl+shift+alt+l", "command": "workbench.action.tasks.showLog" }, { "key": "ctrl+shift+alt+r", "command": "workbench.action.tasks.runTask" }]This will make the main commands quicker to access. Do not hesitate to adapt the bindings to your preferences.
Debugging code
Also, in VSCode there is a Debug tab on the menu. To use it with Babylon.js you need to install an extension, find out more from Debugger for Chrome.
With the test task running from the VSCode debug tab, chose the section you want to debug and launch the debugger.
Debug session will debug all the Typescript and JavaScript in Chrome and stop on your breakpoints set up in files in VSCode. It debugs all the code from src, materialsLibrary, procceduralTexturesLibrary, postprocessLibrary, etc.
Hint: If another chrome session is already running on remote debug on port 9222 the debugger will fail to attach as the port is already open. You will have to close the other remote debug first.