Node Geometry Editor
What Is Node Geometry Editor?
The Node Geometry Editor will be familiar for anyone who has already used the Node Material Editor. This editor, like the Node Material Editor, was created to speed up the process of creating Node Geometry and reduce the amount and complexity of code that needs to be written to generate Node Geometry. Additionally, users will not need deep knowledge of the Node Geometry Class as the tool handles all of the necessary syntax and validation for us.
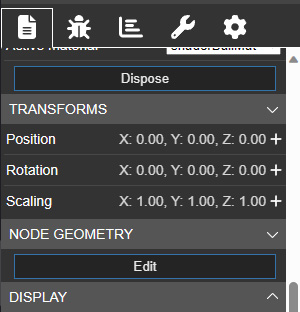
The tool is available as a stand alone experience by visiting Node Geometry Editor and can also be opened from the inspector when selecting any Node Geometry in scene.
Interface
The interface for the editor is broken into 4 main sections as can be seen below. The node list is the entire list of available nodes that can be dragged onto the graph. At the top of the list is a search box to help narrow the list. The graph is the workspace for arranging the nodes to create the geometry flow. There is a panel for parameters and controls on the right side of the window which displays any parameters available to the currently selected node. If nothing on the graph is selected, this panel shows controls for the tool itself to load, save, or change default settings. In the bottom right is the preview window which displays the current Node Geometry output. Lastly, at the bottom of the window is the console log panel which gives information the build status of the current graph.
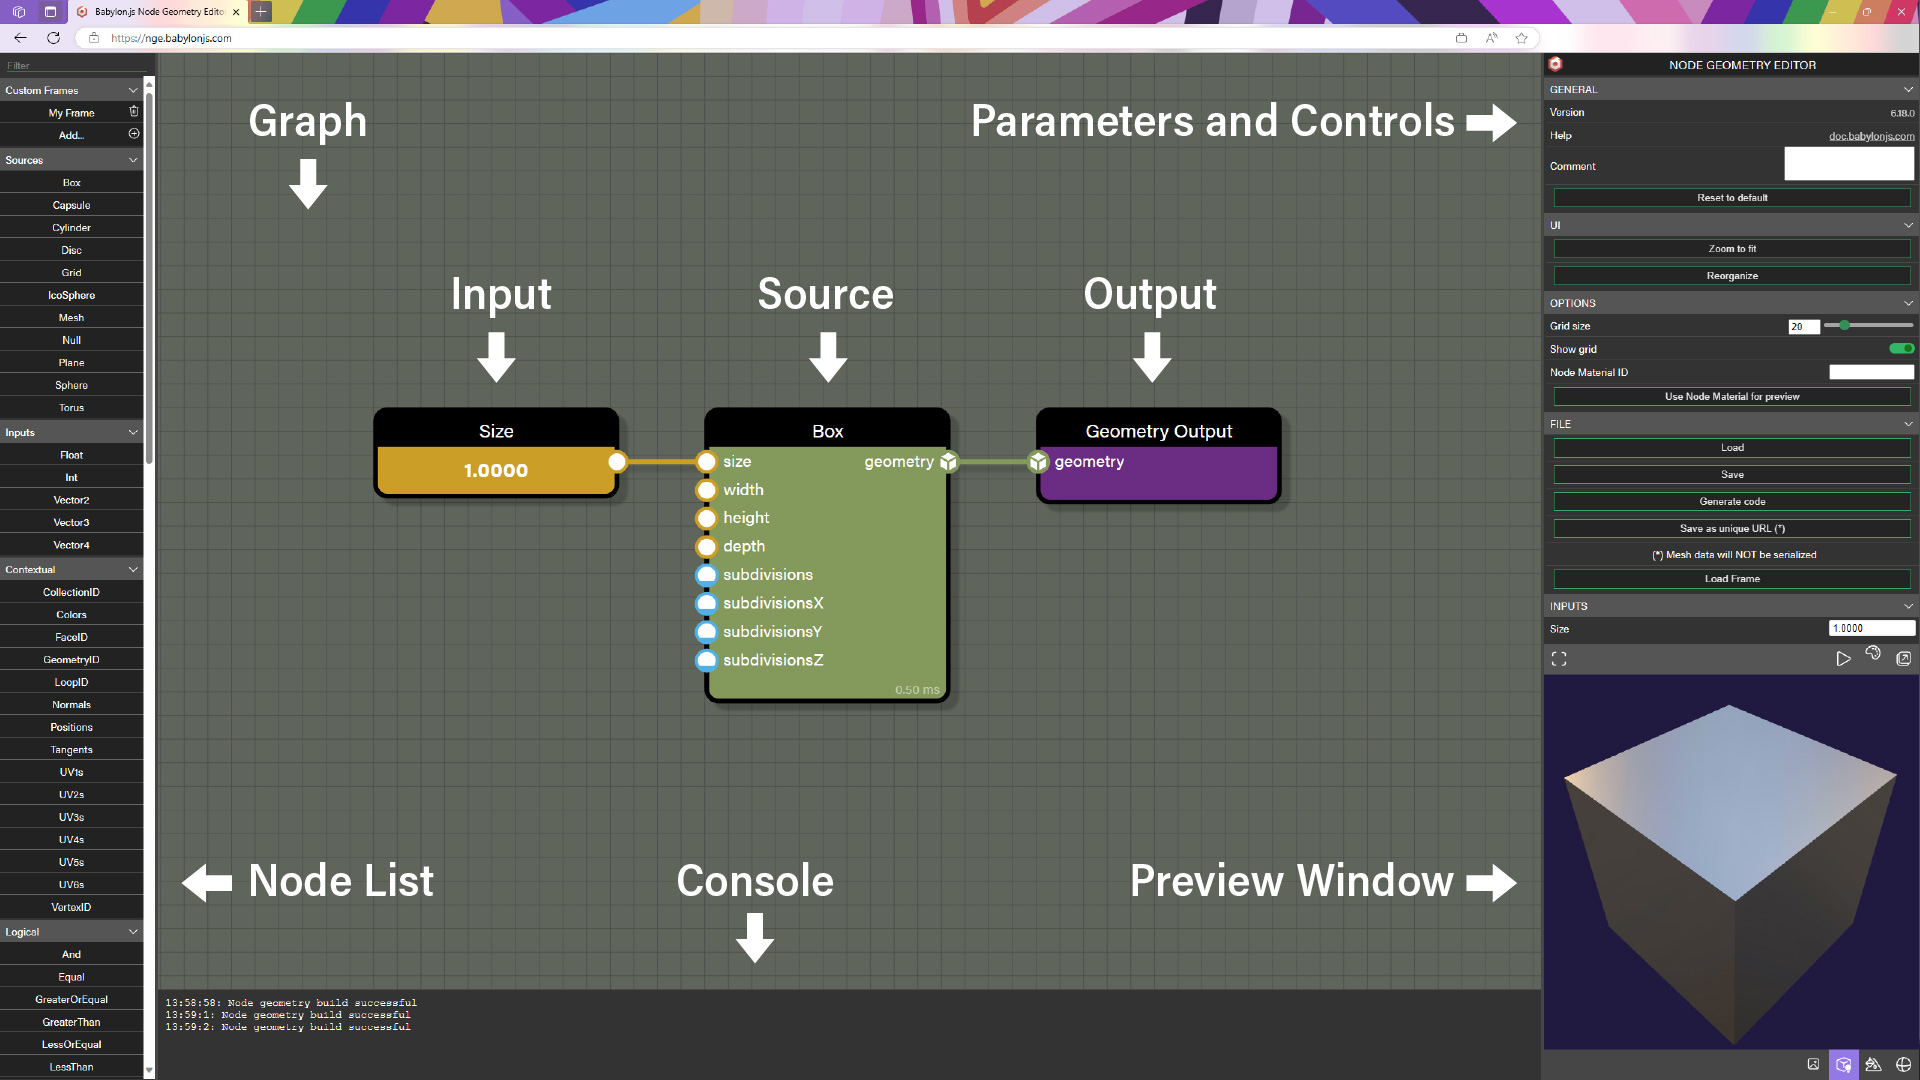
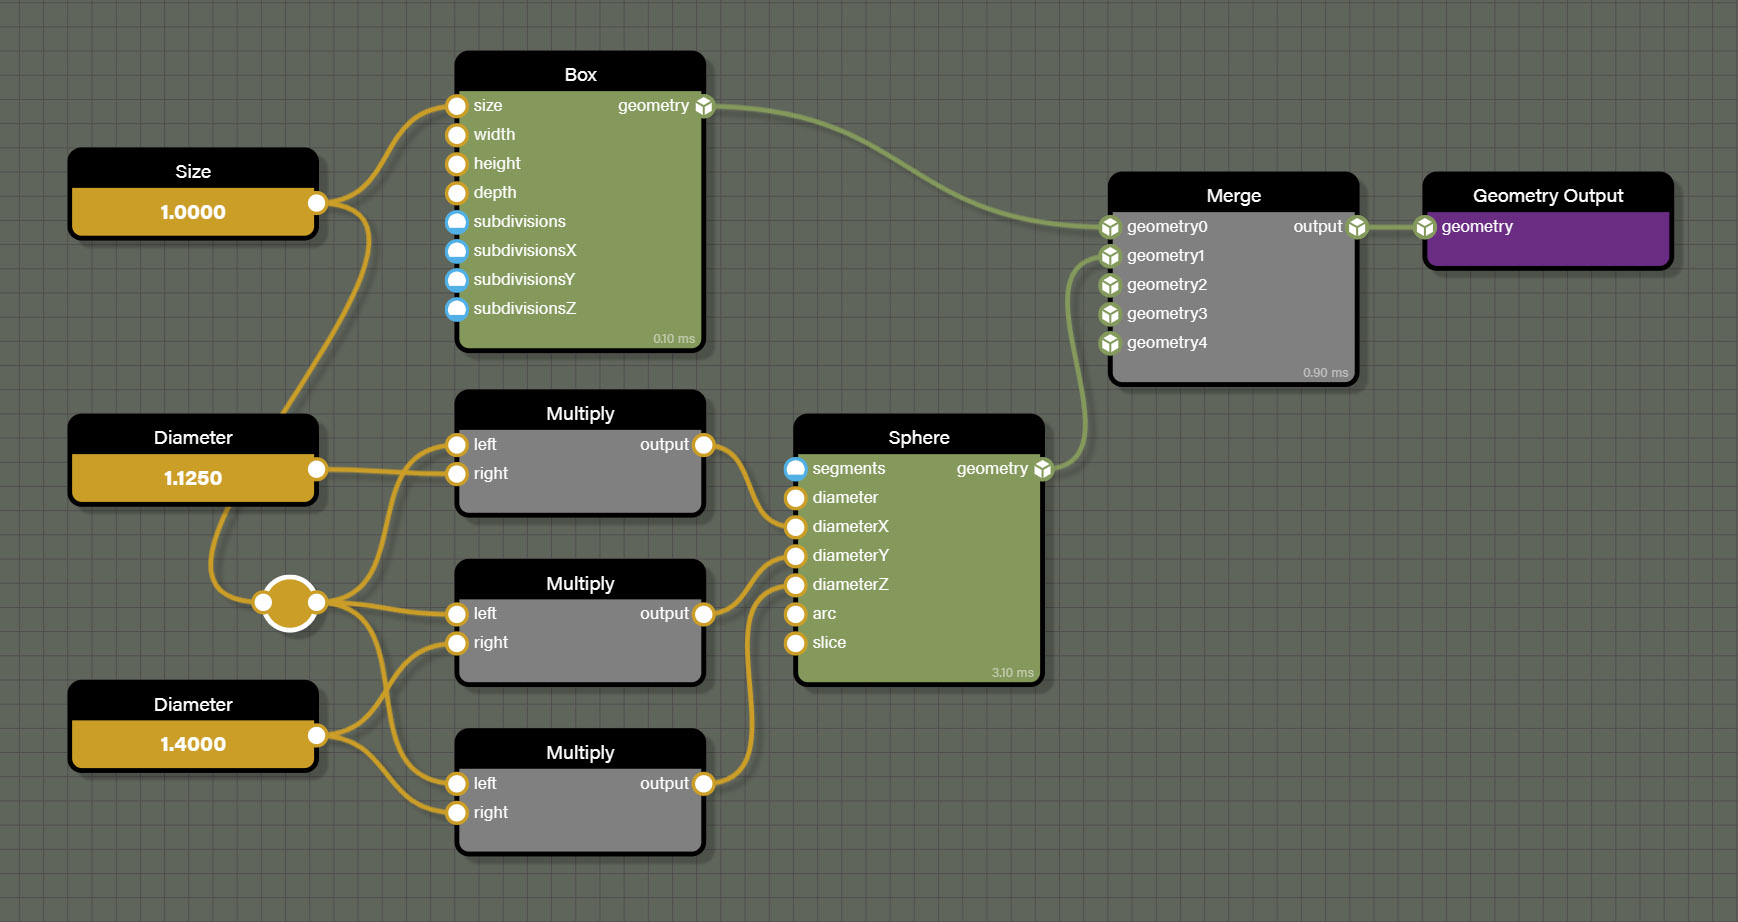
The image above shows three types of nodes available in the graph, an input node, a source node, and an output node. At minimum all graphs need exactly one output node and at least one source node. Note that the inputs and outputs on the nodes share colors and icons that give hints on what can be connected. Since the Geometry Output node has only a geometry input, there needs to be at least one node supplying that input.
Input is just one type of several other node types such as contextual, logical, math, and more. Connecting these different node types to the source nodes can produce an almost limitless variety of meshes.
Adding Nodes
Adding nodes to the graph is one of the most common actions taken while working with the editor. There are two main methods for adding node to the graph. The first method is clicking and dragging a node from the node list onto the graph and releasing the mouse button. This will drop the selected node at the mouse position. The node list can be filtered by entering a keyword in the search bar at the top of the list to help find a node faster.
The second method is to press the space bar for a shortcut to open a search window with a the full node list at the mouse position on the graph. Once the window is open, we can simply start typing to enter a keyword in the search bar. Once the list is filtered, use either the mouse to click the desired node or use the arrow keys to highlight the desired node and press enter. This will drop the node at the mouse position when the shortcut was invoked. If a wire was selected when the shortcut was opened, the editor will attempt to connect the node in the middle of the connection that was selected. If the node to be placed contains compatible inputs and outputs, a connection will be made.
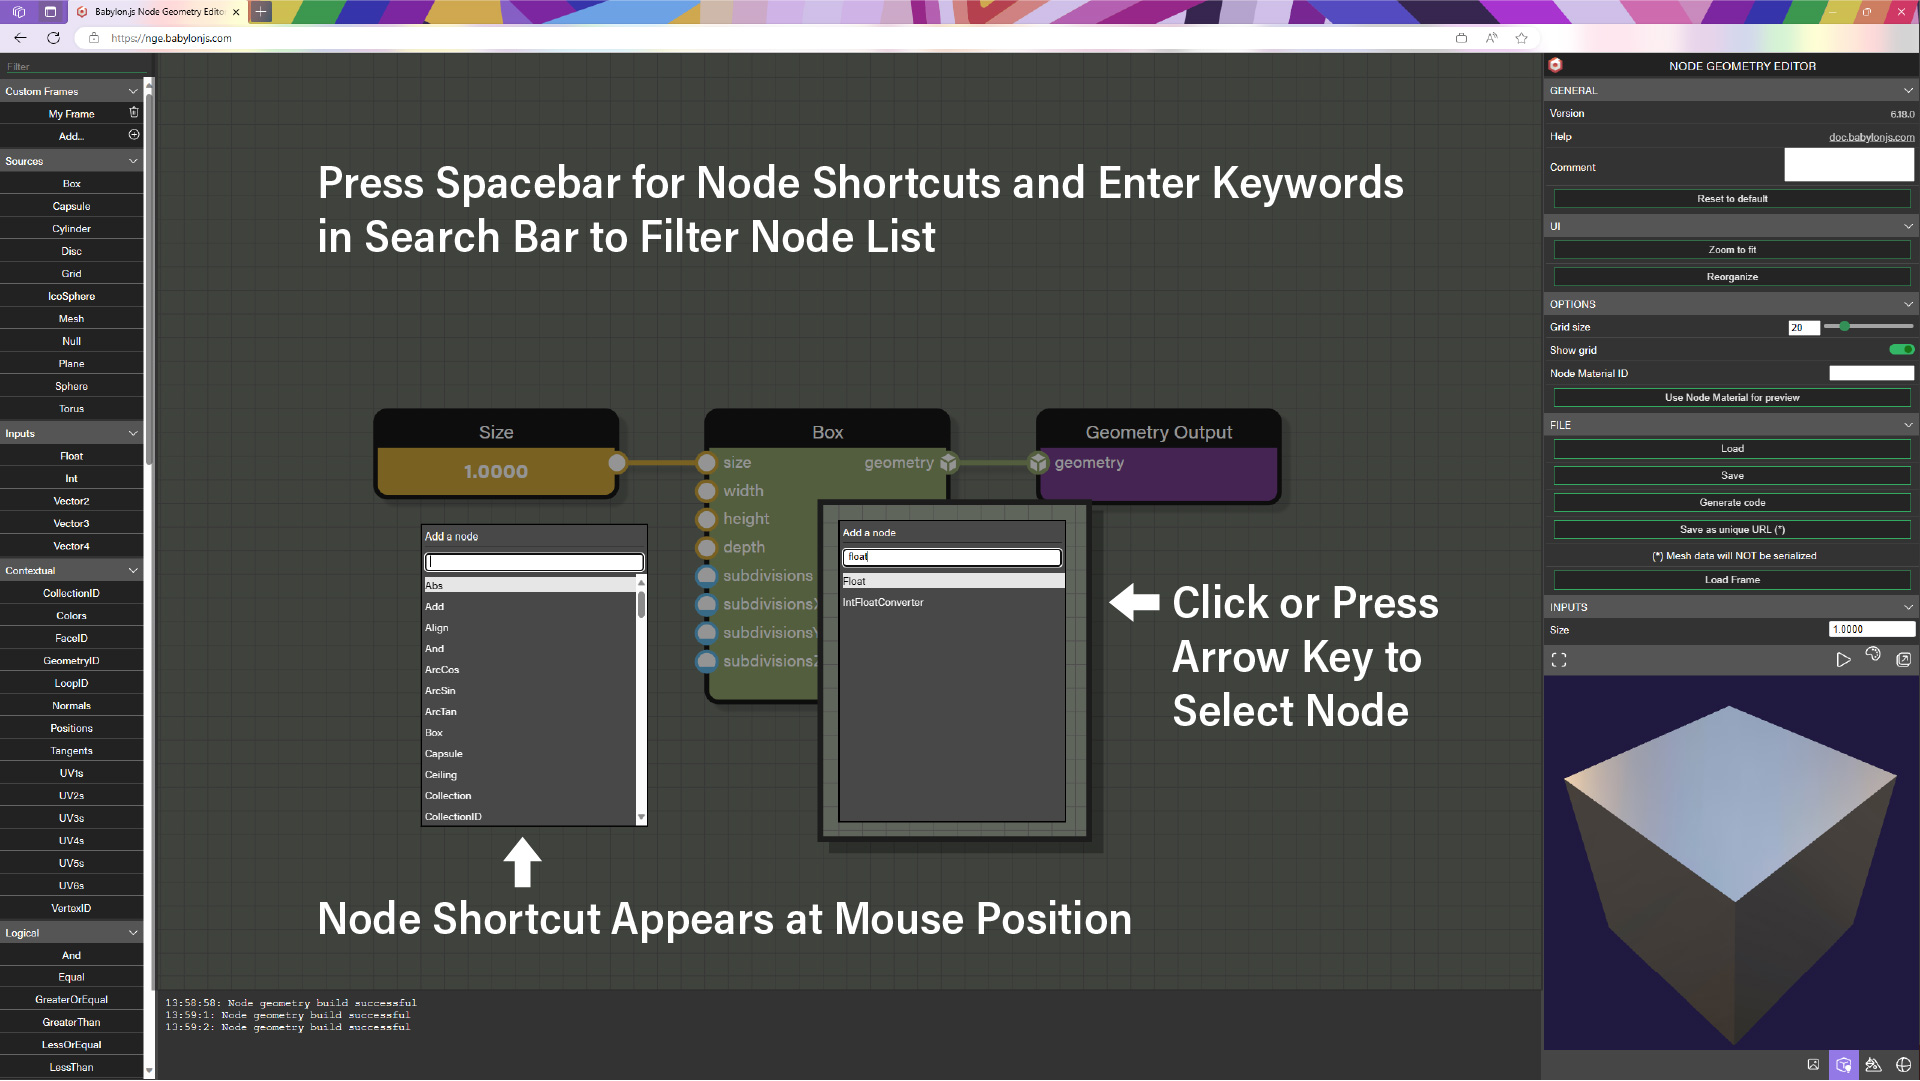
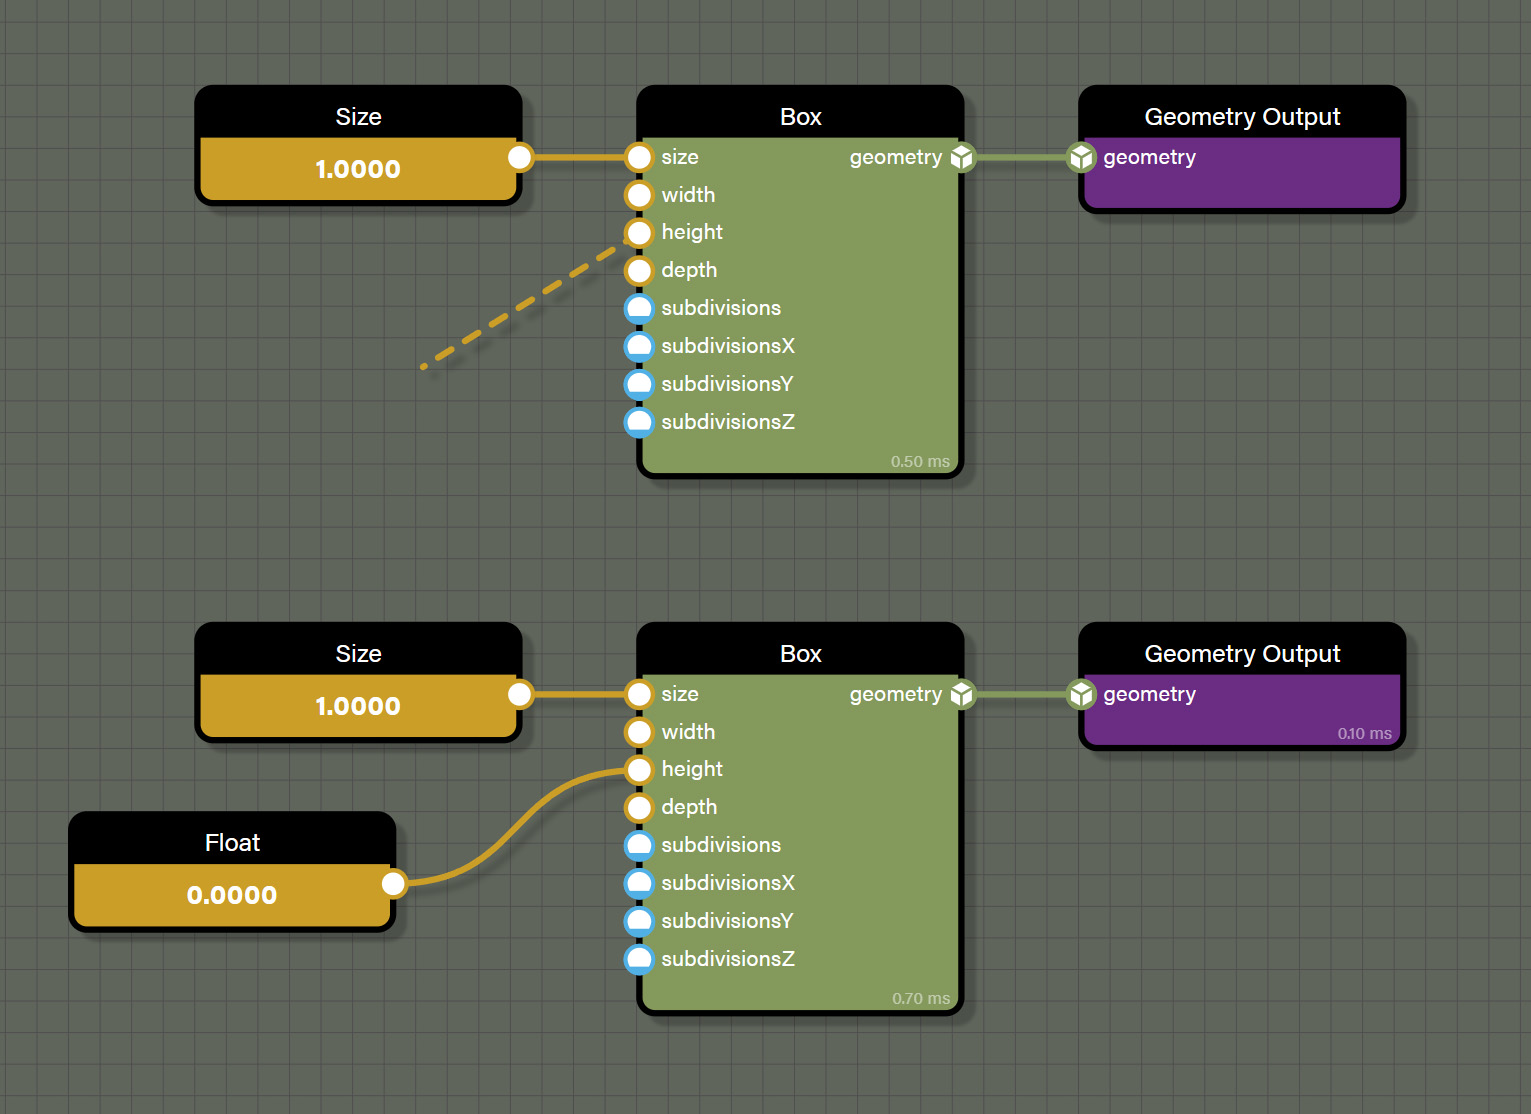
There is one other shortcut to quickly add nodes in a contextual manner. For most node inputs with a defined type, we can simply click on the input and drag to the left of the node which will drag out a dashed wire of the type the input expects. Once the mouse button is released, an input node of the correct type will be dropped. For example, the image below illustrates clicking on the height input of the Box source node and dragging a dashed line to the left of the node. Once the mouse button is released, a Float node is added to the graph at the mouse position.
Connecting Nodes Together
Nodes usually have one or more inputs and one or more outputs, though there are nodes that have only inputs or only outputs. What is common to all nodes, however, is each individual node has requirements for the data that passes through it. These requirements typically take the form of data types that the nodes expect for their calculation. To easily tell what type of data a node expects is to look at the inputs and output icons on the node. To help decipher the icons, please refer to the legend below:
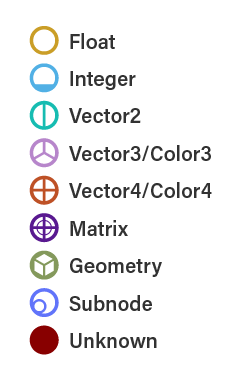
The first six types are self-explanatory and are the most common data types that will be seen on nodes. The next two - Geometry and Subnode - are special data types that are narrowly defined. The Geometry type is used exclusively in Node Geometry Editor and refers to the actual mesh that the node affects. The Geometry type is also the only available input for the GeometryOutput node which is the output for the graph which makes a geometry source - one of our simple shapes or an imported mesh - a requirement for the graph.
Subnode is rarely found on nodes and it refers to nodes that have exactly one other node they can be connected to. Mostly this is used to reduce complexity on a large node moving optional operations or parameters to another node. While they are not commonly found on nodes, seeing the subnode icon is a good indication to look for another node that can take this node as an input.
The last type - Unknown - is not really a data type, but a prompt to us know that the node supports multiple data types. If a supported data type is connected to an Unknown type port the attached type will convert all Unknown ports to the connected type. In this way, Unknown type ports will only appear on a node that does not have any connections.
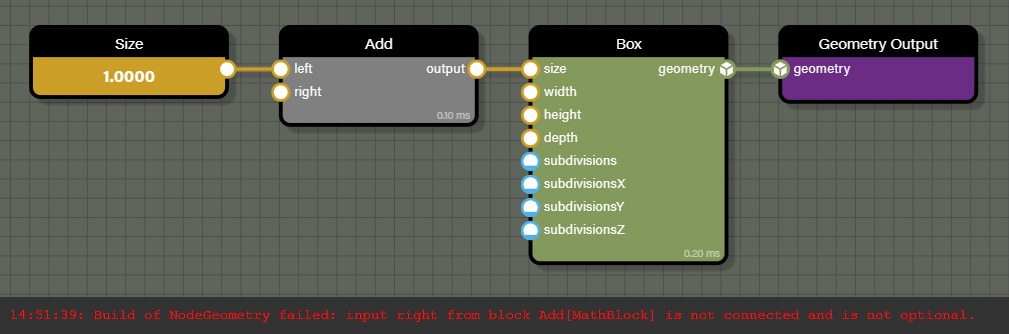
Anytime a node requires a specific input to be wired, the console log will display an error saying the graph cannot be evaluated until all required inputs have been connected. As shown in the image below, the add node needs to have both the left and right inputs connected to complete the evaluation of the graph. Since only one input has a connection, there is an error displayed in the console describing which block is missing a connection.
Shortcuts for Connecting Nodes
There are several shortcuts to help speed up connecting nodes which can save a lot of mouse clicks. The first is to select a node and then press the space bar to open up the node list shortcut. Select a node to add to the graph and the added node will attempt to wire a connection to the selected node if there is a compatible input type on the added node. This method won't always result in an automatically wired connection if the editor can't find a compatible input type. And if no automatic wire is desired, simply ensure there is no selected node by clicking on an empty area of the graph to deselect all nodes before adding a node with the node list shortcut.

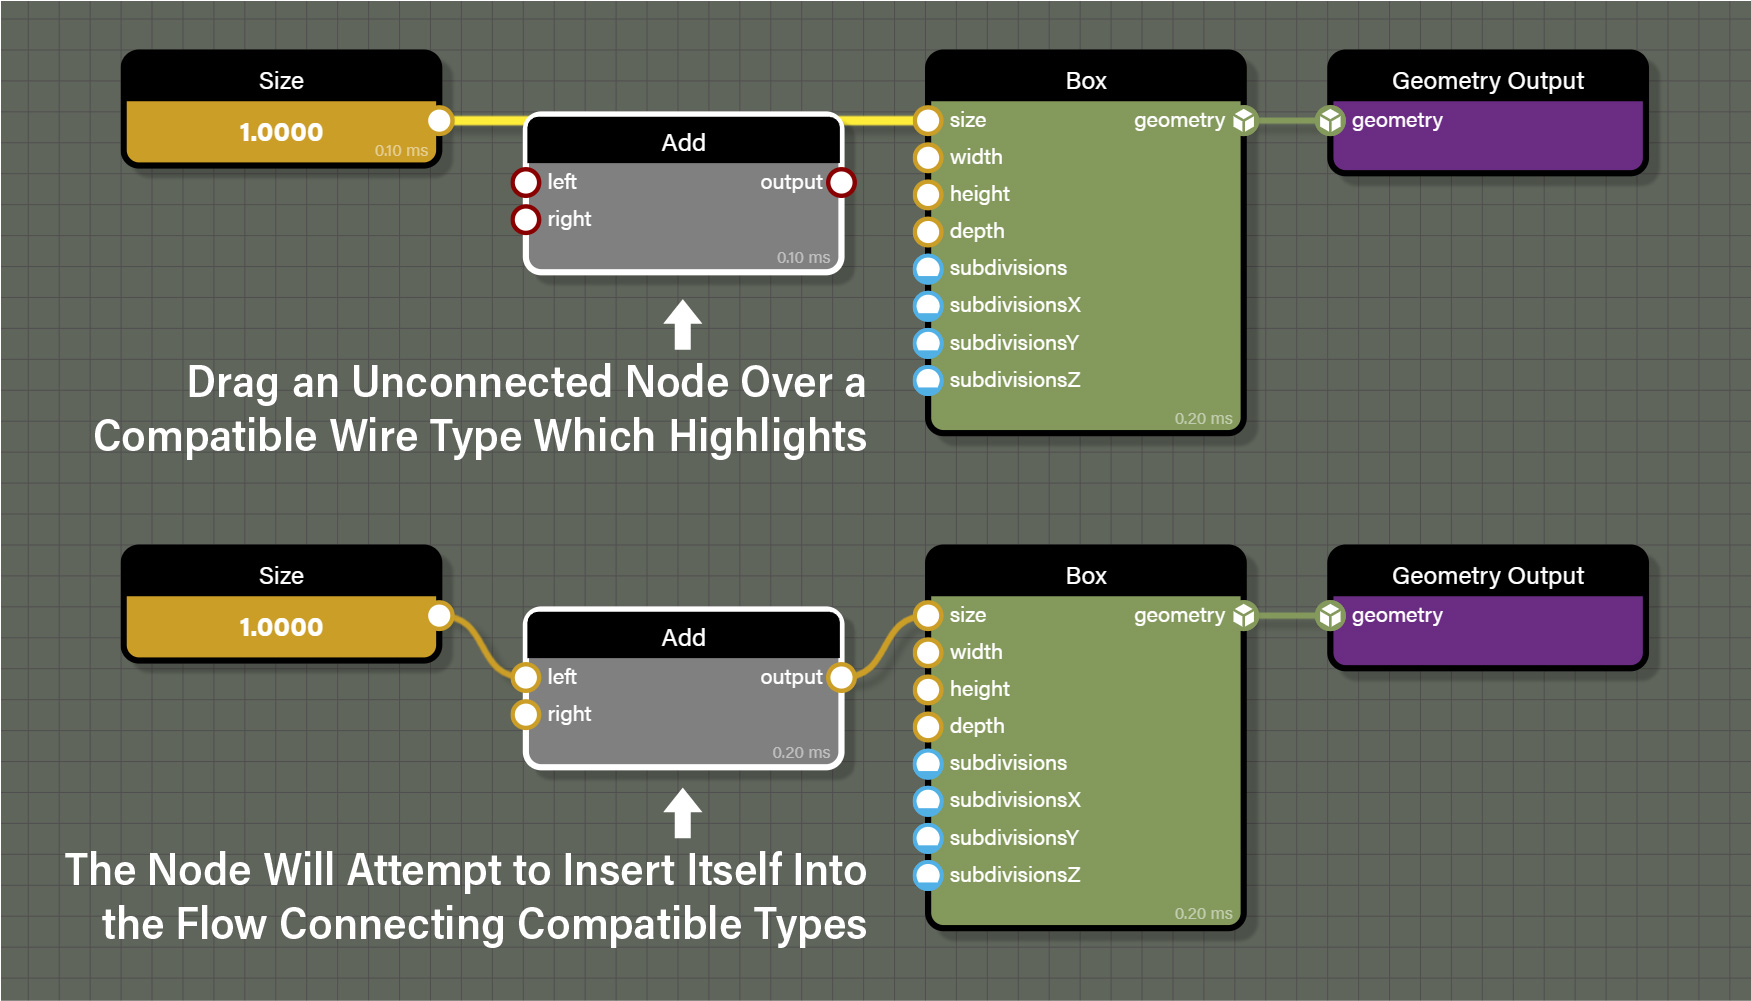
Another shortcut to be aware of is dropping a node onto an existing wire to automatically connect compatible inputs and outputs. The node needs to already be in the graph for this to work, so drag it from the node list to the graph first. Then when dragging the node over a wire, the wire will highlight if the dragged node has inputs that are compatible with the data type represented by the wire. When releasing the mouse button, the editor will attempt to connect both inputs and outputs of the new node to maintain the original flow for the graph. There are, however, instances where a new node dropped on a wire in this way will still prevent the graph from being evaluated, mostly due to the new node having requirements that are not met. For example, in the image below the add node is dropped on the wire connecting a float to the size input of the Box node. The add node will connect the first compatible inputs and outputs it finds to retain the original flow, but in this case the graph won't build because the add node needs another float type connection to the right input before it can evaluate.
The last shortcut to be aware of is really two different actions that are performed with a similar shortcut. The first allows a quick deletion of a connection simply by holding alt and left clicking an input port or output port. However, if alt is held and the left mouse button is clicked and held on a port, instead of deleting the wire, the wire is disconnected from the port allowing the connection to be moved from one port to another.
This works for both input ports and output ports, but there is one further shortcut that can be chained to this shortcut. Remember that we stated above that if an input port is clicked and a wire is dragged to an empty part of the graph that an input node of a matching type will be created. This also works when moving a wire so that if alt is held and an output port is clicked and held, the wire is removed from the output node as normal. Now simply move the wire to an empty part of the graph and release the mouse button and not only will the original output port be disconnected from the original wire, but a new input node that matches type with the wire will be created where the mouse button is released.
Graph Organization
When working with any node graph tool, organization can make a big difference in being able to read a graph and understand it. Whether a graph is to be shared with others who also need to be able to understand the graph or if we come back to a graph at a future date when we've forgotten about the choices we made when creating the graph, there are several practices we can use to alleviate confusion.
Naming
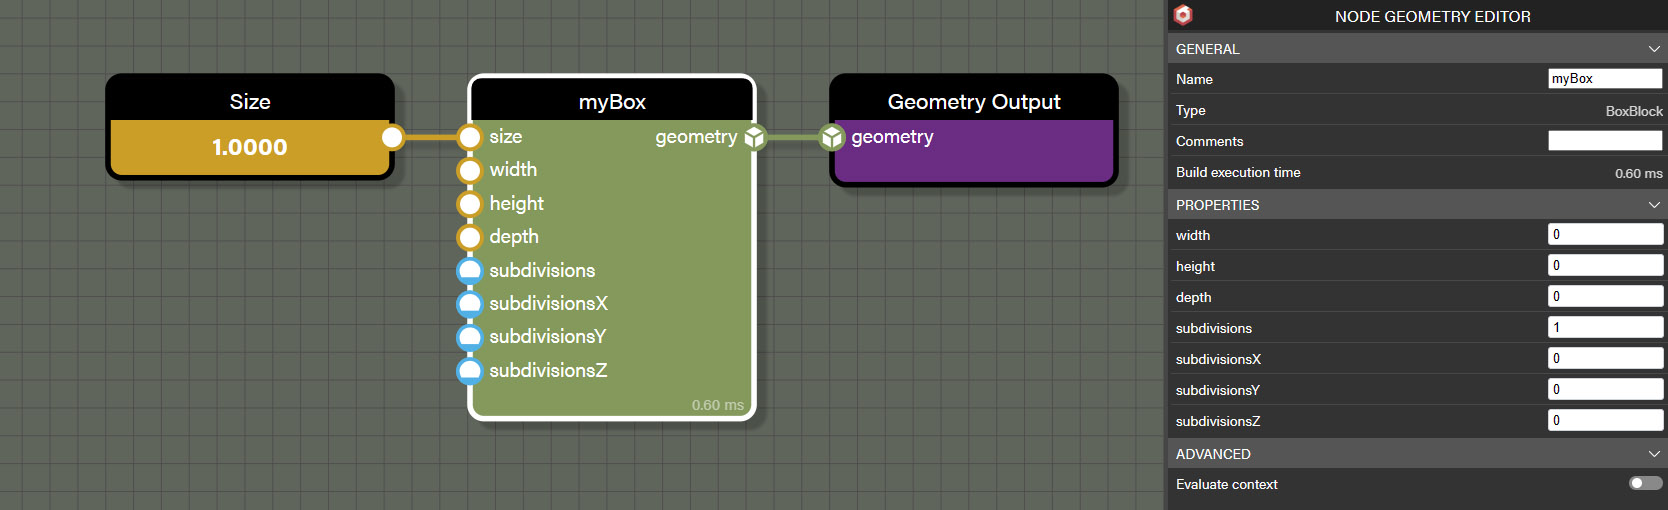
Every node can be assigned a custom name in the parameters panel. Naming can be done just to help us remember what the node is doing or it can be done to enable us to get a particular node from our code to set a value. No matter what a node is named, the original node type is still visible in the parameters panel so renaming a node like add won't cause any confusion about what the node is doing.
Node Comments
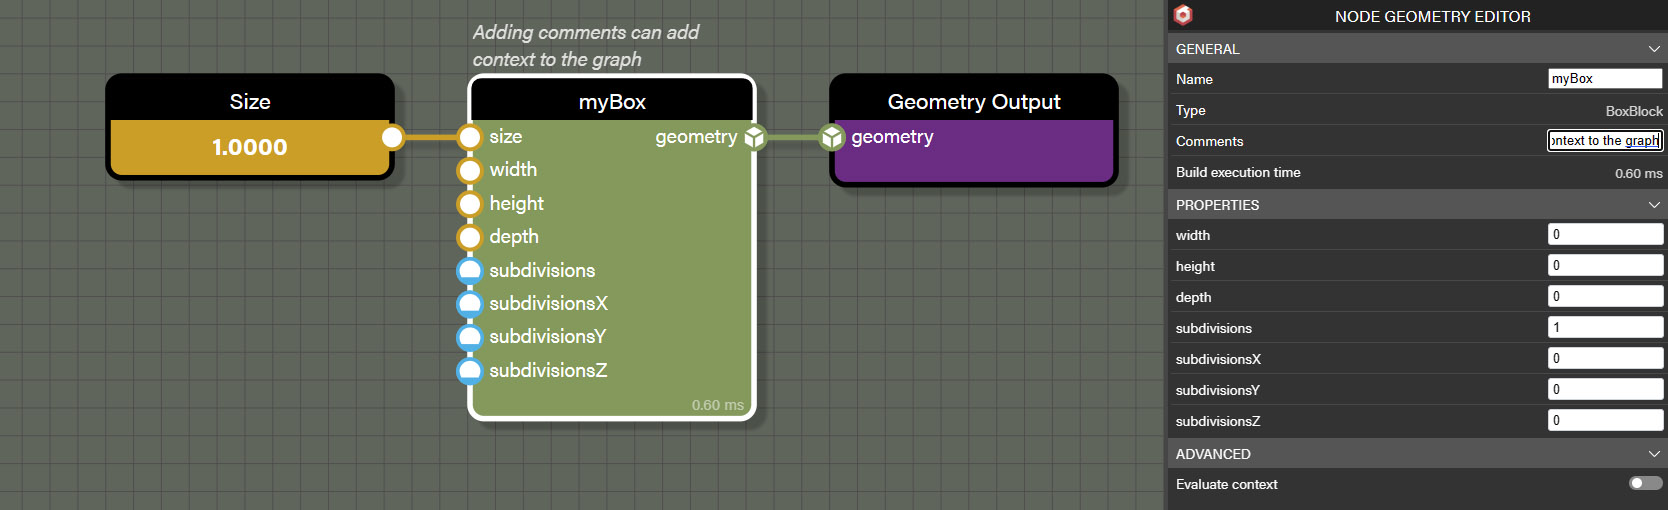
The name of a node is a limited way of communicating what a node is doing. If a longer explanation is required, a comment can be added to a node which will display on the graph above the node. The limitation here is that the comment will maintain the same width as the node and wrap lines as necessary. This means that very long comments aren't great to use on nodes as they can be harder to read and require a clear graph behind them to be read.
Frames
To help group nodes together visually, frames can be drawn around them by pressing and holding the shift key while clicking and dragging a selection around the desired nodes. Clicking and dragging the header bar of the frame will move all nodes contained within the frame with the frame. It can be resized by hovering the pointer on a side or corner of the frame to fine tune the nodes that the frame encompasses.
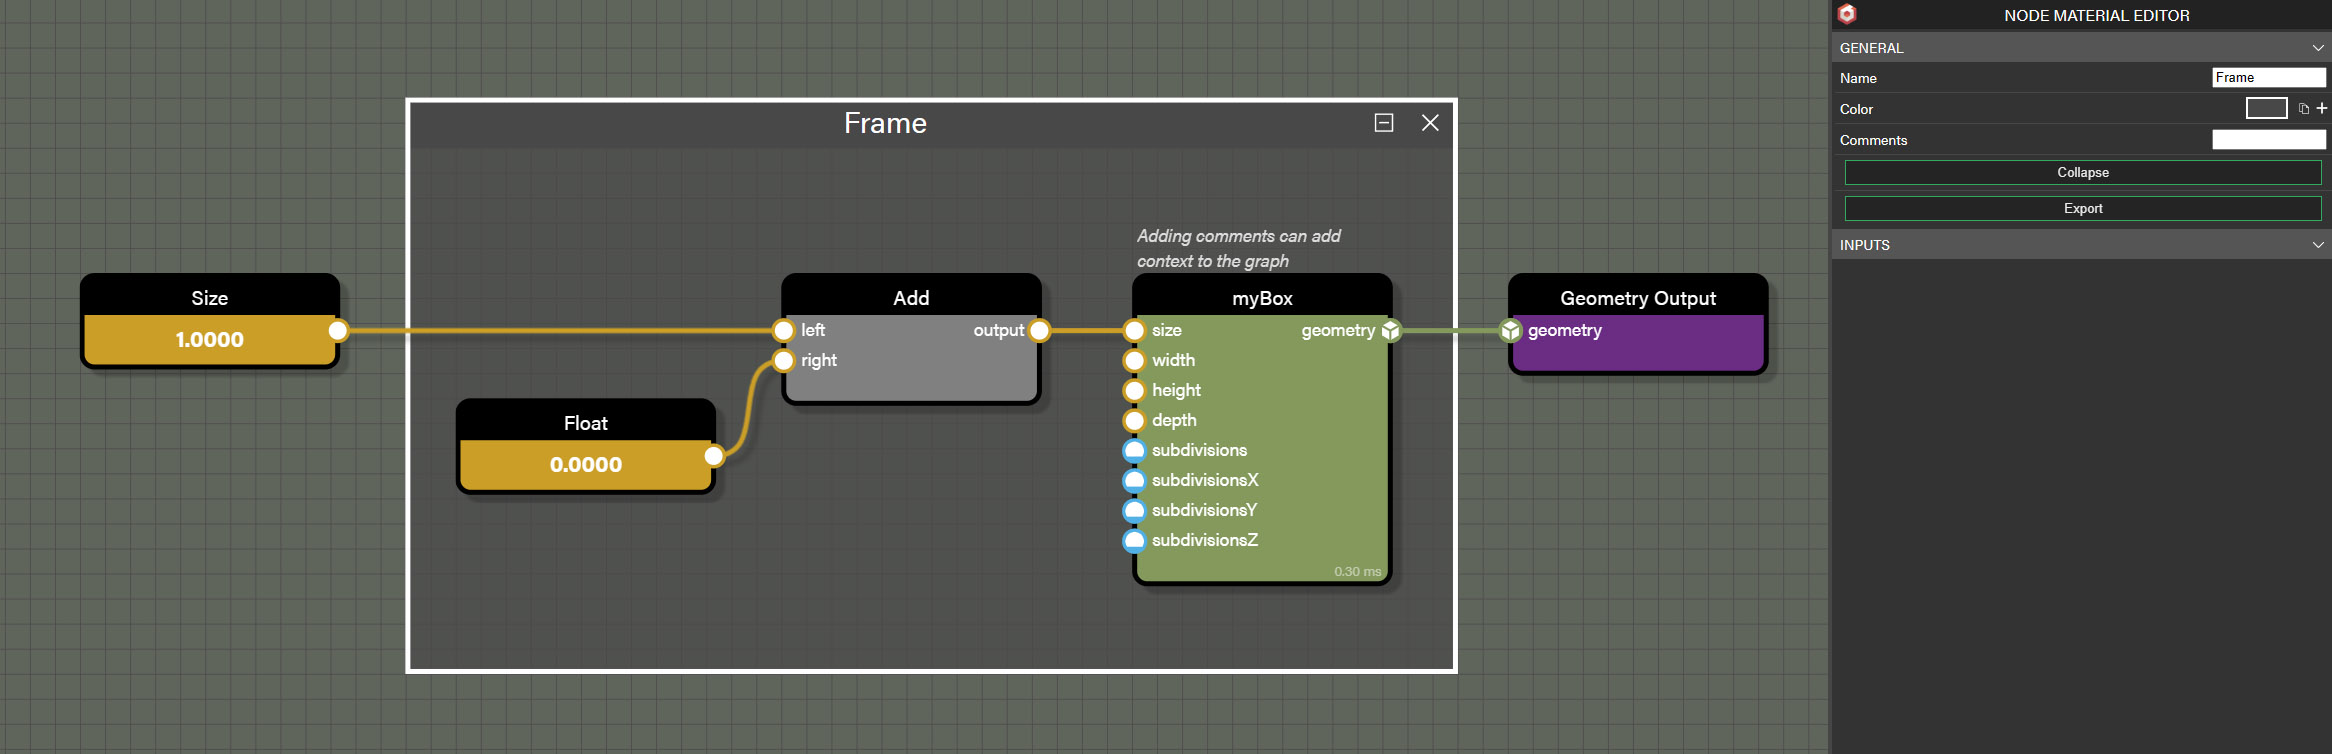
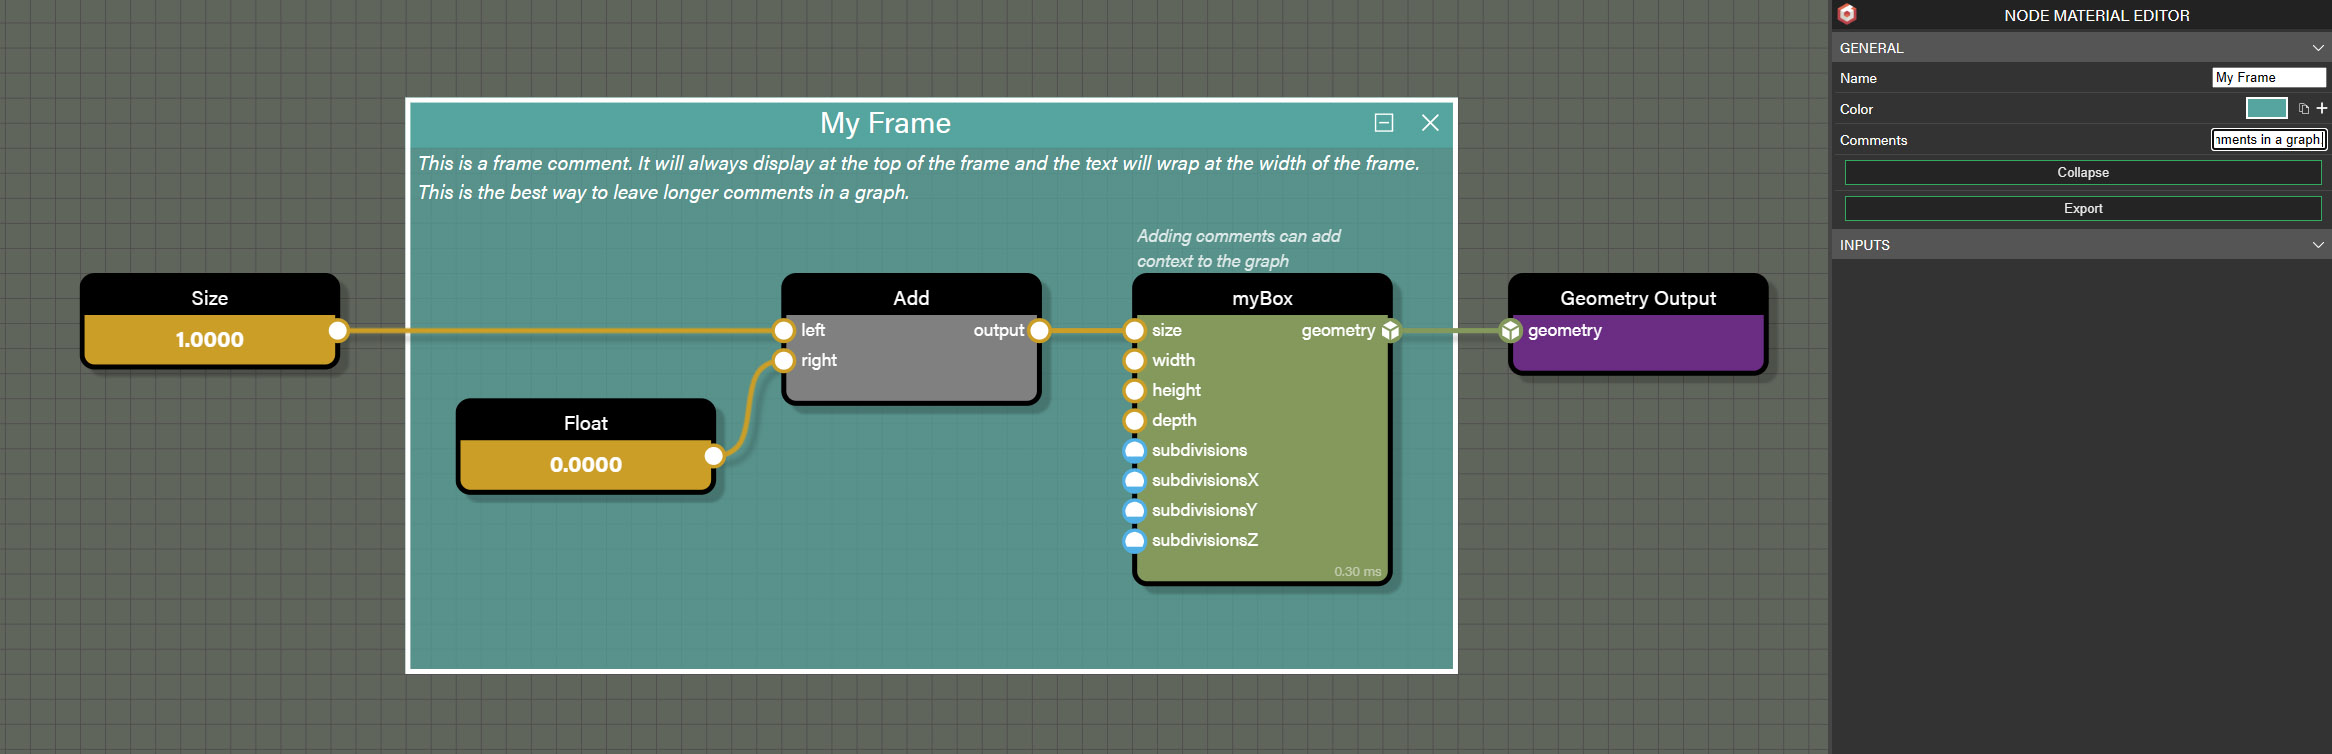
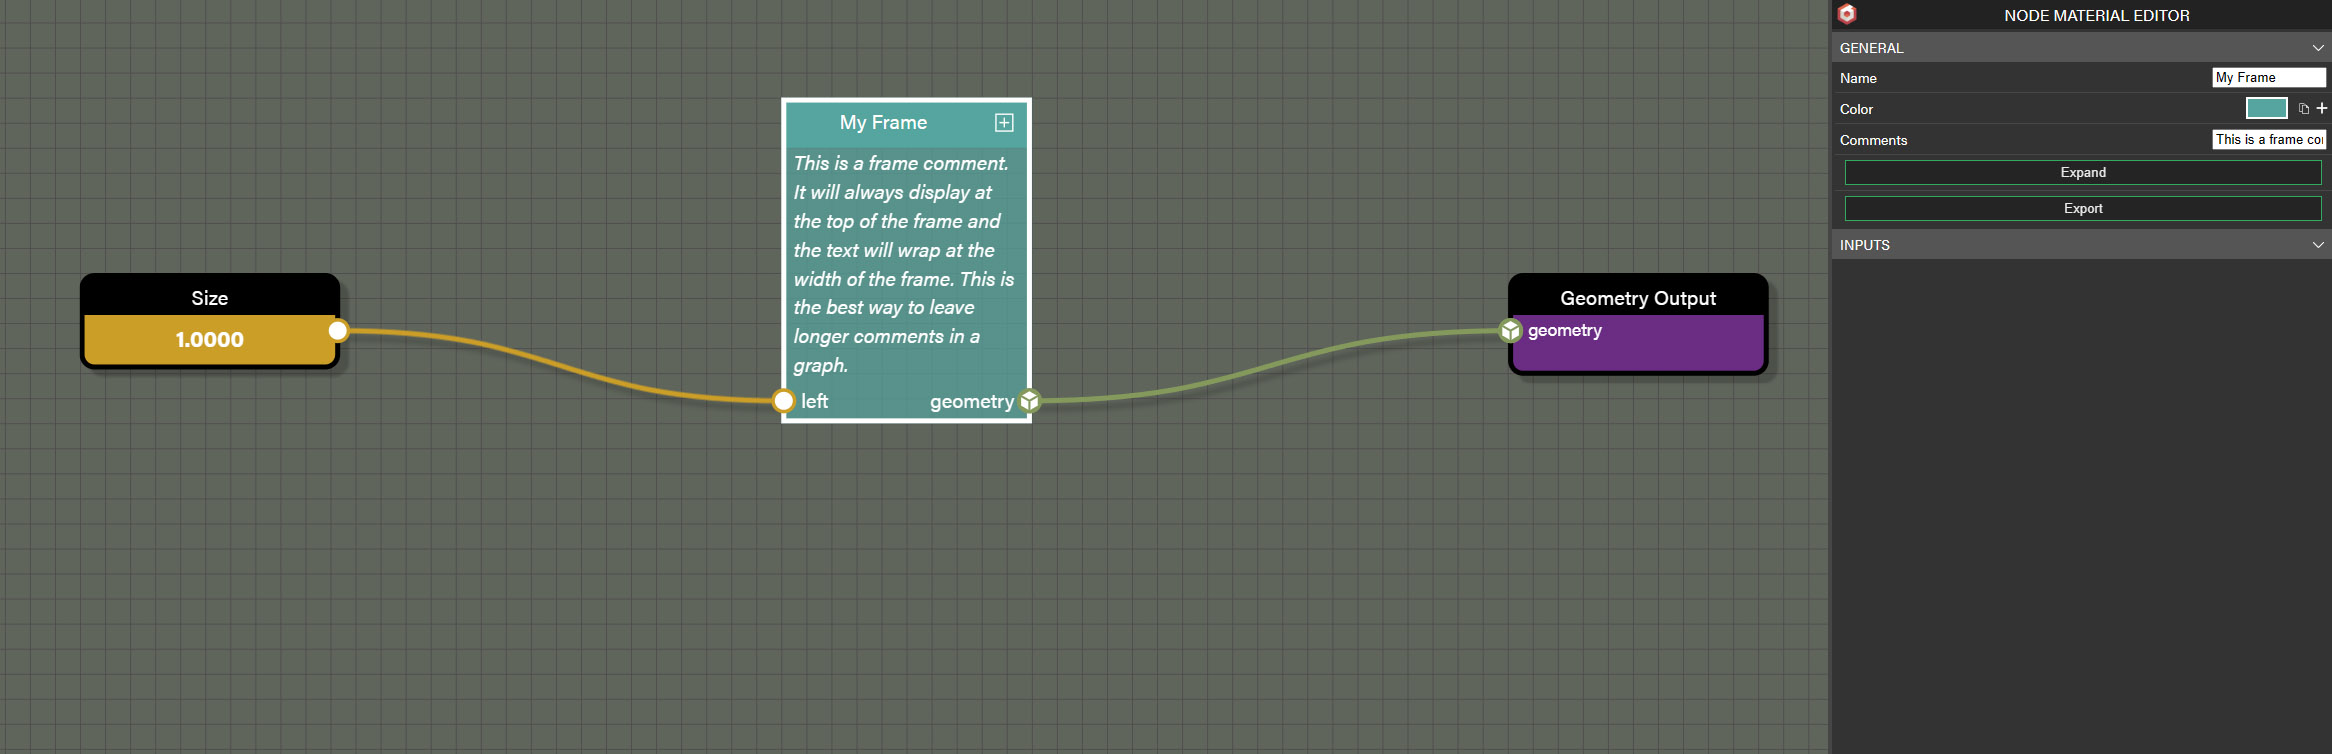
Frames can also be customized to help them stand out when looking at a graph. They can be given custom names and colors right in the parameters panel. Importantly, comments can also be added to frames and are displayed at the top of the frame. Comments will text wrap at the width of the frame so this is the best way to leave longer comments in the graph to describe what a section of the graph is doing.
Note that on the header bar for a frame there is a close button to remove the frame. Right next to the close button is a collapse button which will collapse the frame and all contained nodes to a small format that tries to mirror the size of the common nodes. The frame name and comment are still visible when a frame is collapsed. Any wire that crossed the border of the frame when expanded will become an input or output on the collapsed frame. This allows even more organization of the graph by minimizing sections of the graph and saving space. Any wire connected to the inputs and outputs on a collapsed frame will be routed to the original nodes inside the collapsed frame.
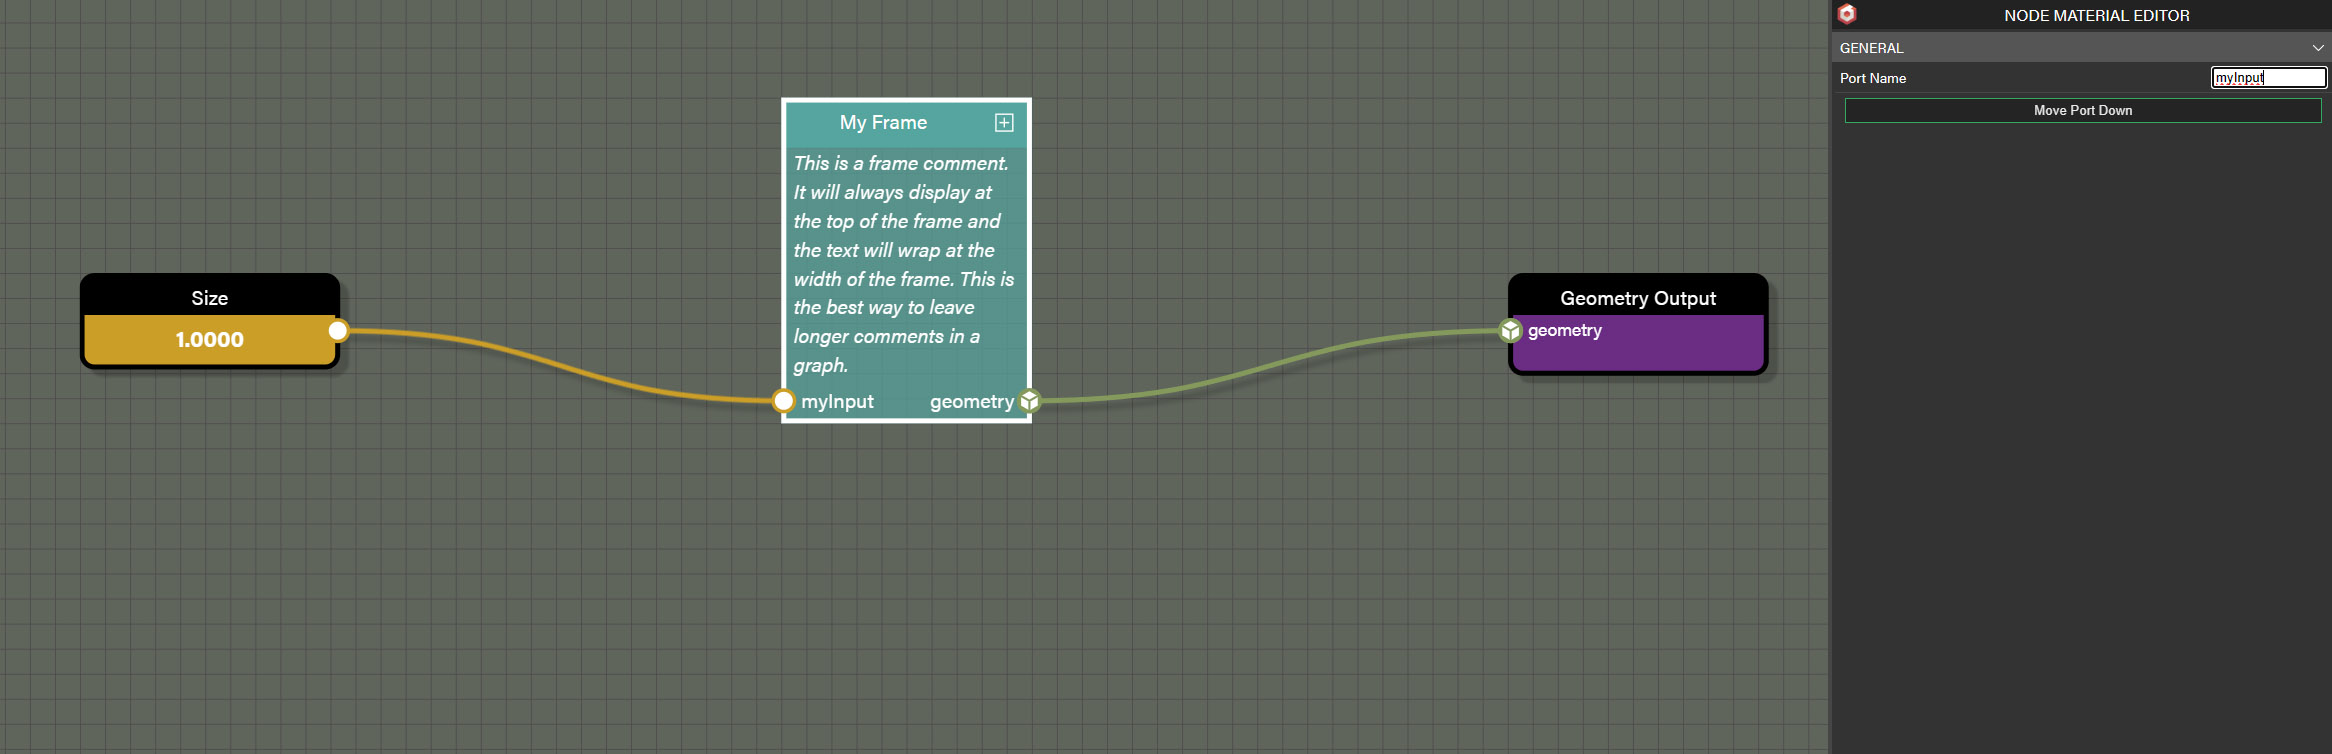
The names of the inputs and outputs are taken from the name of the input or output where the wire originated. To help with clarity, however, by clicking on any input or output on a collapsed frame, the parameters panel will display an option to set a custom name. This allows collapsed frames to be more specific about where the port will lead inside the frame when collapsed. Expanding the frame will retain the original node positions and wire passing outside the frame. Note that an input or output that was renamed when collapsed will retain the custom name when expanded.
Custom Frames
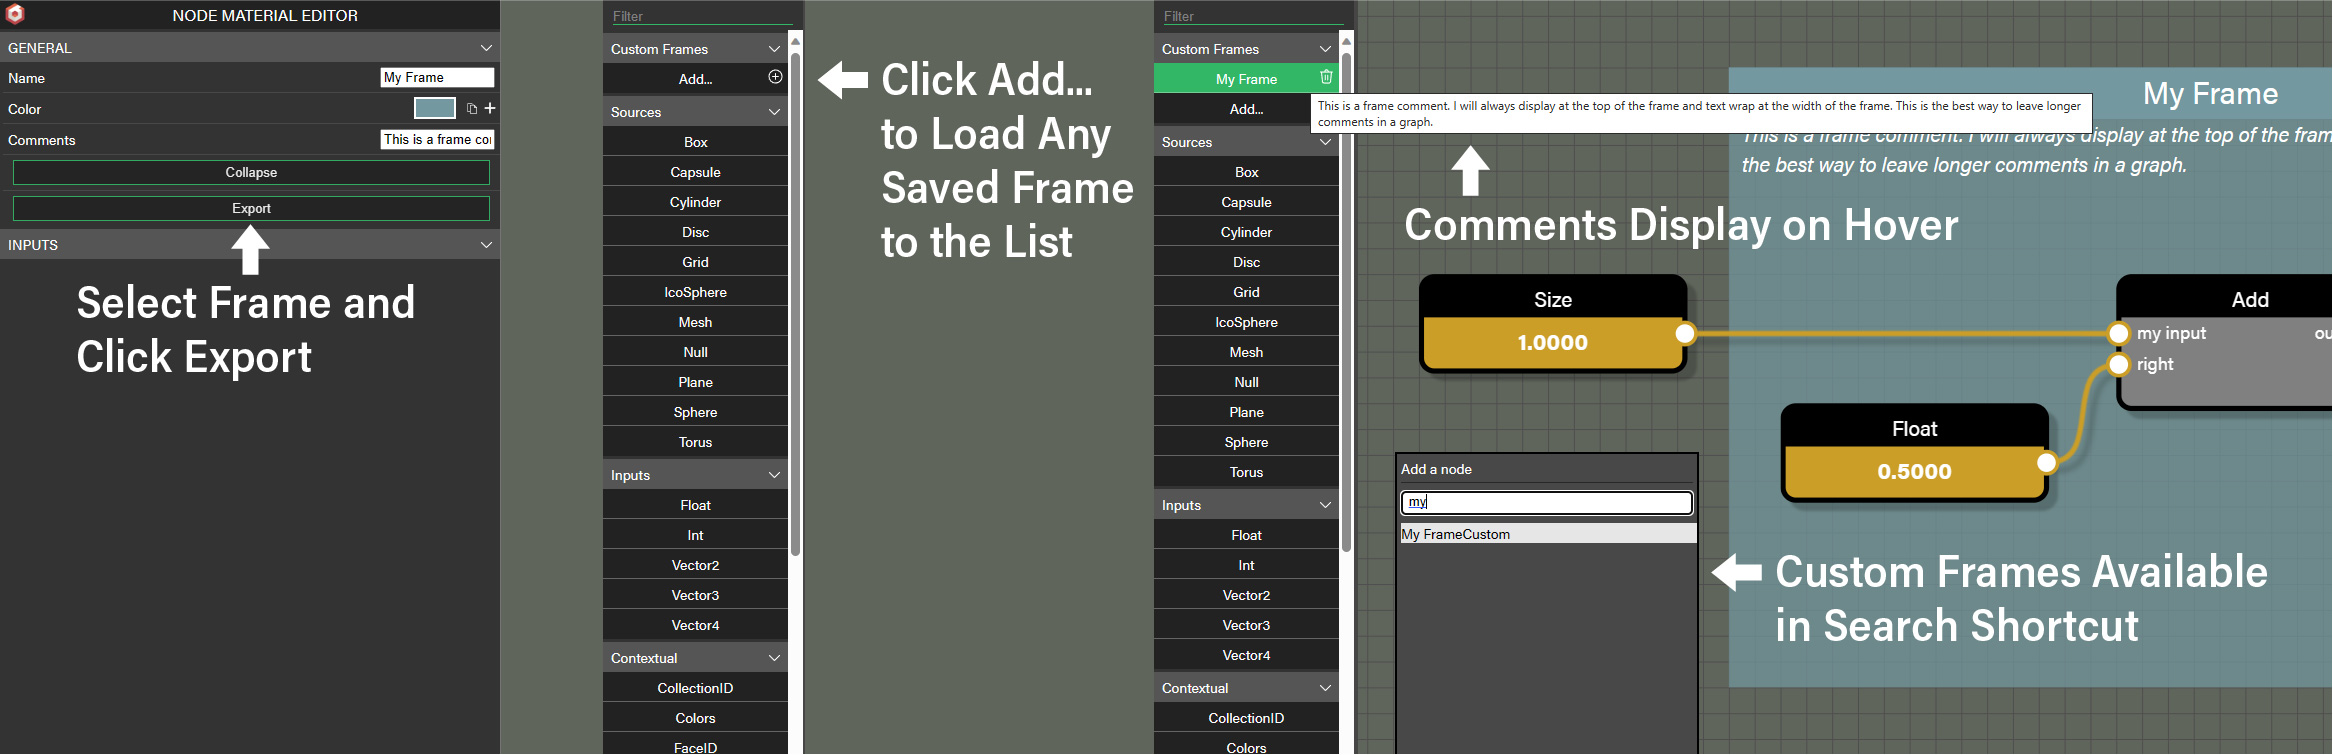
Frames also enable reuse of parts of your graph elsewhere. If there is a part of a graph that seems like it could be a common operation through a collection of mesh graphs, simply create a frame around the nodes and export the frame using the Export button in the parameters panel. Clicking on the Add... button under Custom Frames in the node list enables import of the custom frame into the node list. Once imported to the node list, the custom node will be available any time the editor is launched so it only needs to be imported once. Additionally, the frame comments will appear as a tool tip when hovering the frame in the node list to give context to each frame as the custom frame list grows.
From there the custom frame can be dragged into the graph as any other node and will place in collapsed form to reduce the amount of needed space. Custom frames also appear in search results so searching in either the node list or the shortcut node list opened with the space bar will return custom nodes to make adding them even faster. Once in the graph, it acts like any other frame and can be expanded, collapsed, and arranged in any manner desired. The frames can also be directly edited in the graph or changed completely. In this way, custom frames can act like a template bringing in common collections of nodes to a graph and speeding the process of creating graphs.
Wire Elbows
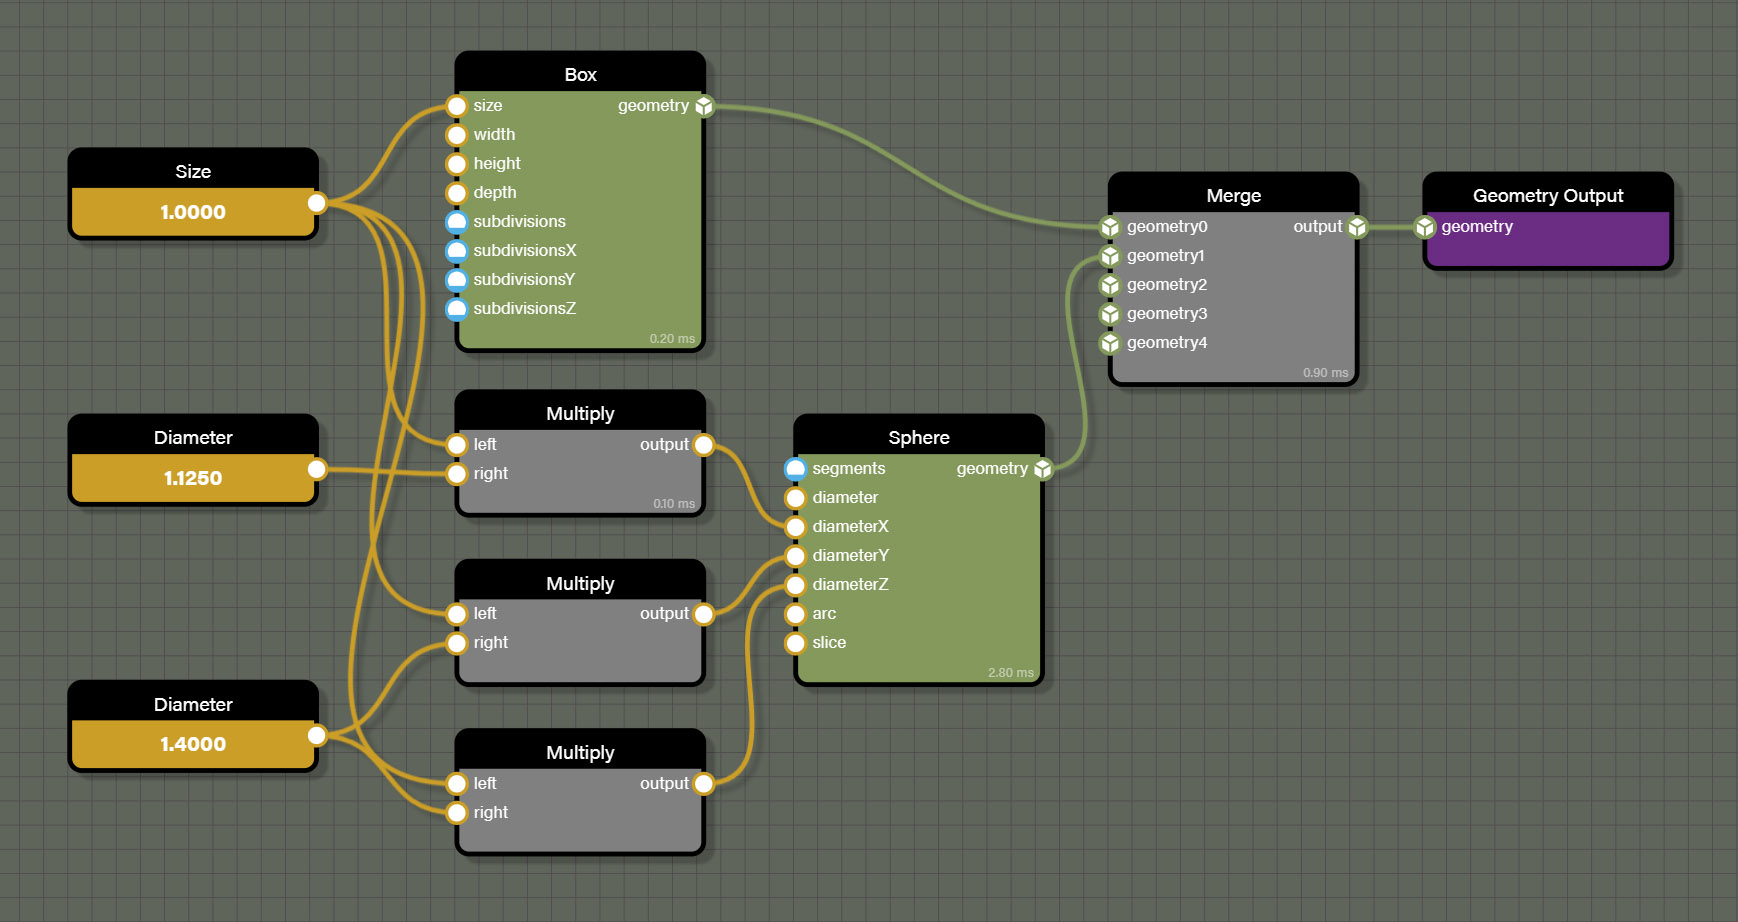
When working with graph editors, one of the ways it can be hard to read comes from the natural process of wires connecting different nodes turning into spaghetti. If it is not clear which path a wire is taking because it crosses or overlaps other wires or sits beneath other nodes, comprehension of the graph goes down and it takes longer to understand what the flow is actually doing. Where frames help organize nodes, elbows help organize the wires in a graph. Consider the graph below and note that the overlapping wires can make it hard to discern which wires are flowing to which nodes.
Elbow nodes can help to re-route wires in a graph allowing the user to bend and/or redirect wires into a more readable format. Adding an elbow is like any other node where it can be added from the node list or the search shortcut accessed with the space bar. However, there is a simpler way to add an elbow to a wire. Simply hover the cursor over a wire that needs an elbow and the wire will highlight. Next, hold the option key while left-clicking the mouse on the wire. An elbow will be added to the wire at the cursor position at which point it can be moved around or be the source for more connections to other nodes as seen below.
Editor Options
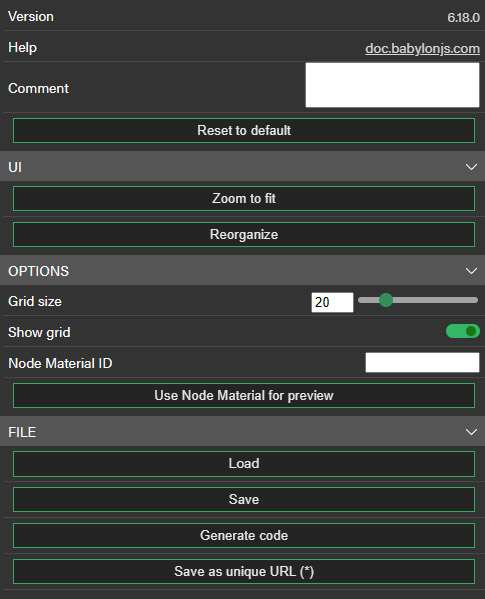
When clicking on an empty portion of the graph, the parameters panel will display general options for the editor as well as save and load actions. Let's take a moment to go through each of the available actions.
- Reset to default will reset the entire graph to the default state. This is useful for clearing the entire graph to start over but use with care as this action is not reversible.
- Zoom to fit will set the magnification and pan for the graph so that all nodes are visible at once. This is helpful if the graph is panned away from the nodes and it is not clear which direction to pan to return to the flow.
- Reorganize will perform a cleanup for all nodes in a graph. It will attempt to rearrange all nodes so that none overlap one another. It will also attempt to flow nodes from left to right so that wires are not doubling back on themselves. It will also respect frames and try to rearrange nodes within the frame's area without changing the size of the frame. There are times when the reorganize won't be able to optimize due to how nodes are wired, but it will attempt to optimize the node layout.
- Grid size will change the spacing of the grid lines in the graph.
- Show grid will toggle the display of the grid in the editor.
- Node Material ID is used to display a node material on the preview mesh in the editor. To use a node material, it must be saved to the snippet server and the snippet ID is placed in this field.
- Use Node Material for preview will load the node material from the snippet linked above to be used on the preview mesh in the editor. If another node material is desired, change the snippet ID in Node Material ID and click this button to load a new snippet.
- Load will load a graph from a local JSON file. This will replace whatever nodes have been placed on the graph with the loaded node graph.
- Save will save the current node graph to a local JSON file. For production projects, saving local JSON files is preferable to using the snippet server to ensure that the JSON is always available to the project from the local server.
- Generate Code is used to generate the core Node Geometry code as a text file saved as a local file. This code can then be used directly in a javascript file to create the Node Geometry graph without the need to load and parse the JSON file. For optimization considerations, it may be preferable to have Node Geometry created directly from code in the project and skip any parsing actions.
- Save as unique URL(*) will save the current node graph to the snippet server and generate a snippet ID that can be parsed into an experience with only the snippet ID. This is a great option for sharing graphs or for prototyping, but isn't a good choice for production as the snippet server exists outside a project's local infrastructure and should not be relied upon for uptime when a project is live.